Location of the Great Barrier Reef (Effect)
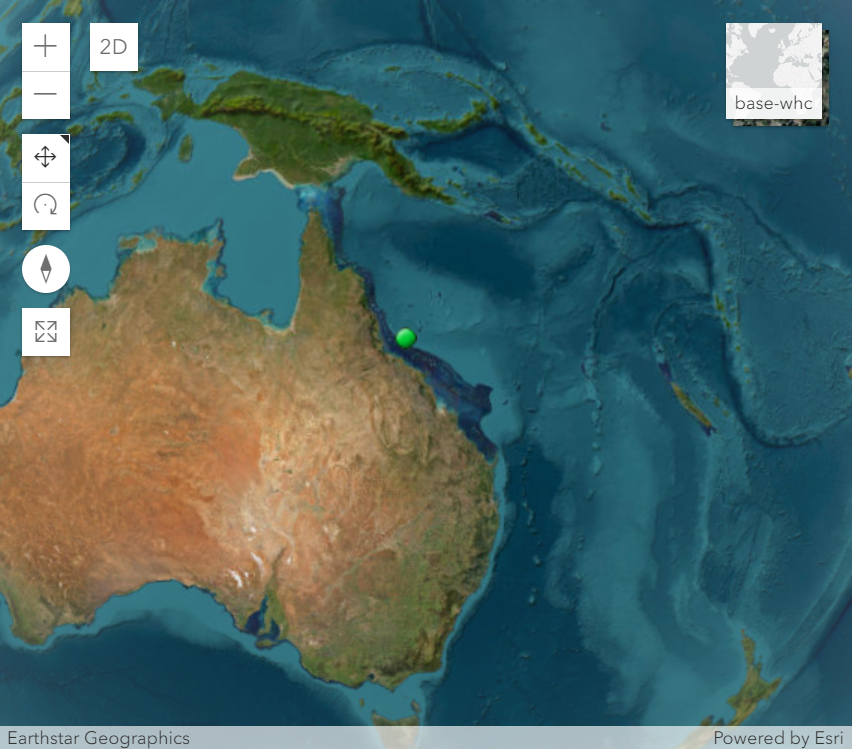
The Great Barrier Reef is located off the coast of northeastern Australia, specifically in the Coral Sea. The reef is close to the shore in some areas, while in other parts it is located further offshore. The Great Barrier Reef extends for over 2,300 kilometers (1,400 miles) along the coast of Queensland, from the town of Bundaberg in the south to Cape York in the north.
The reef is made up of thousands of individual reefs, coral cays, and islands, and covers an area of approximately 344,400 square kilometers (133,000 square miles). The southern end of the Great Barrier Reef is closer to the city of Brisbane, while the northern end is closer to Cairns.
See from the map
Year
Sea surface temperature deciles
Instructions
2013

Sea surface temperatures (SSTs) around Australia were unusually warm throughout the year, with the monthly anomalies for January and February the highest on record and that for November the second-highest on record. This extends a period of sustained record-high SSTs in the Australian region since 2010.
2014

Sea surface temperatures (SSTs) have remained high around Australia in recent years, with all five years between 2010 and 2014 within the eight warmest on record. The preliminary rank for 2014, based on January–November data, places the annual SST anomaly as the fourth-highest since 1900, 0.49 °C above the 1961–1990 average.
2015
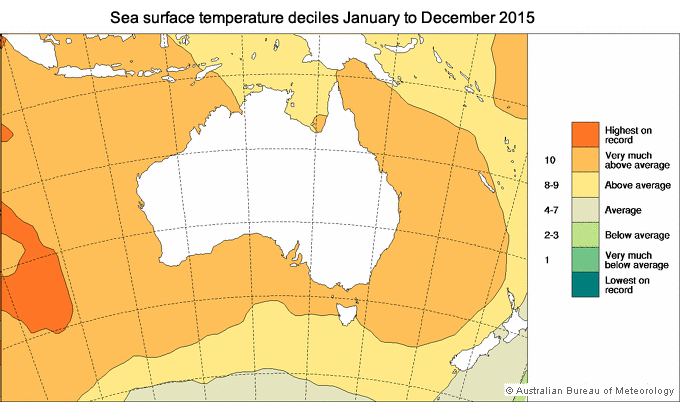
SSTs have warmed substantially around Australia, and have been persistently high in recent years. The 2015 SST anomaly for the Australian region was the third-highest since 1900, 0.54 °C above the 1961–1990 average, based on ERSSTv3b data. The five warmest years on record have been 2010, 1998 (both +0.59 °C), 2015 (+0.54 °C), 2013 (+0.51 °C), and 2014 (+0.50 °C).
2016
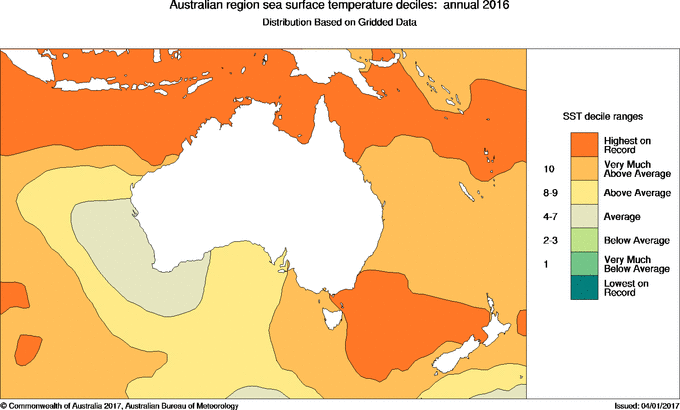
Sea surface temperatures (SSTs) have warmed substantially around Australia, and have been persistently high in recent years. The 2016 SST anomaly for the Australian region was the highest on record (since 1900), 0.73 °C above the 1961–1990 average, based on ERSST v4 data.
2017
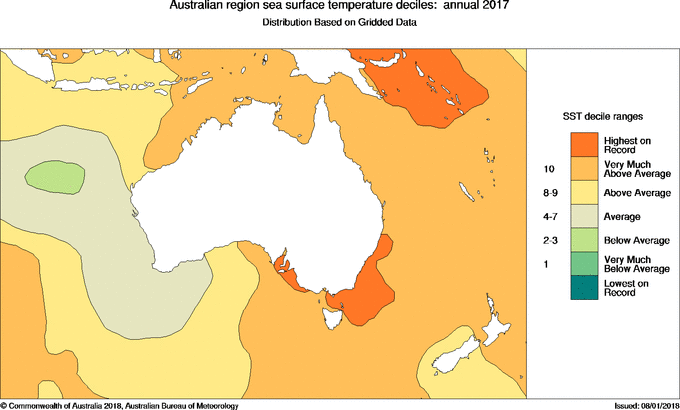
The 2017 sea surface temperature (SST) anomaly for the Australian region was the eighth-highest on record (since 1900); 0.49 °C above the 1961–1990 average based on ERSST v5 data. SSTs around Australia have warmed by approximately one degree since 1900, very similar to the increase in temperature observed over land. Above average annual SSTs have been observed for the Australian region in every year since 1994, and have been persistently high in recent years.
2018
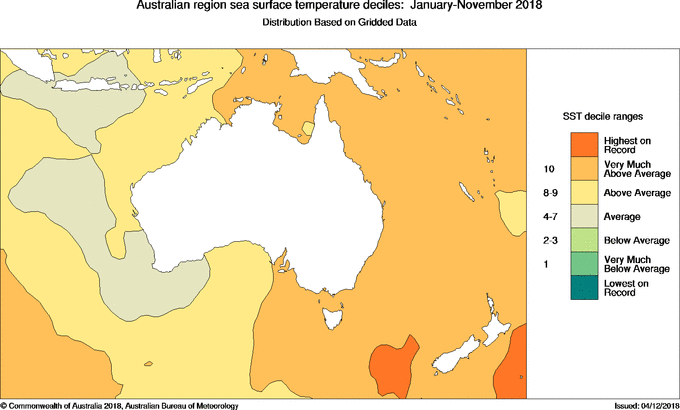
The preliminary annual 2018 sea surface temperature (SST) anomaly for the Australian region was the tenth-highest on record; 0.46 °C above the 1961–1990 average based on data for January to November from the NOAA Extended Reconstructed Sea Surface Temperature dataset, ERSST v5. SSTs around Australia have warmed by around one degree since 1910, similar to the increase in temperature observed over land. Above average annual SSTs have been observed for the Australian region for every year between 1995 and the present, and have been persistently high for the past decade.
2019

The annual 2019 sea surface temperature (SST) anomaly for the Australian region was the equal-20th-highest on record; 0.32 °C above the 1961–1990 average based on data from the NOAA Extended Reconstructed Sea Surface Temperature dataset, ERSST v5. SSTs around Australia have warmed by around one degree since 1910, similar to the increase in temperature observed over land. Above average annual SSTs have been observed for the Australian region for every year since 1995, and have been persistently high for the past decade.
2020
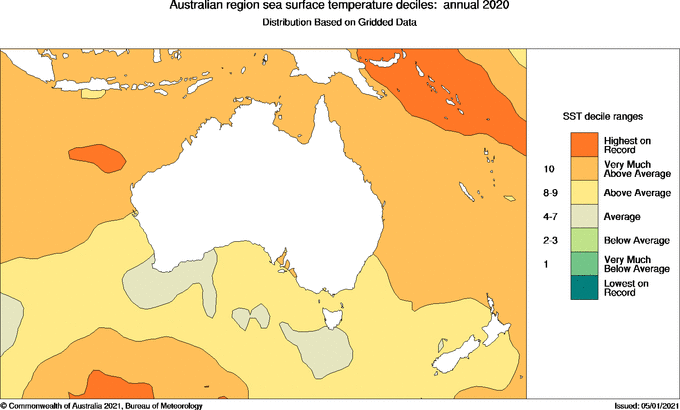
The annual 2020 sea surface temperature (SST) anomaly for the Australian region was the equal-fourth-highest on record; 0.59 °C above the 1961–1990 average based on data from the NOAA Extended Reconstructed Sea Surface Temperature dataset, ERSST v5. SSTs around Australia have warmed by around one degree since 1910, similar to the increase in temperature observed over land. Above average annual SSTs have been observed for the Australian region for every year since 1995, and have been persistently high for the past decade.
2021
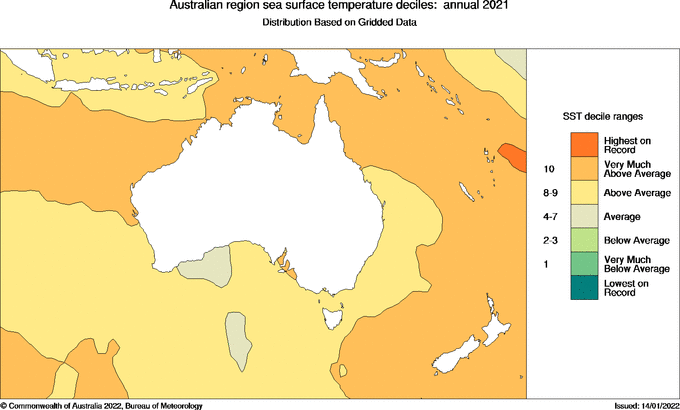
The annual 2021 sea surface temperature (SST) anomaly for the Australian region was the sixth-highest on record; 0.52 °C above the 1961–1990 average based on data from the NOAA Extended Reconstructed Sea Surface Temperature dataset, ERSST v5. SSTs around Australia have warmed by over one degree since 1900. Above average annual SSTs have been observed for the Australian region for every year since 1995, and have been persistently high for the past decade.
2022

The annual 2022 sea surface temperature (SST) anomaly for the Australian region was the highest on record; 0.80 °C above the 1961–1990 average based on data from the NOAA Extended Reconstructed Sea Surface Temperature dataset, ERSST v5. Above average annual SSTs have been observed for the Australian region for every year since 1995.
Leave a Reply